Measuring whether agents help: outcomes over impressions
AI productivity measurement needs outcomes, not impressions: accepted changes, review time, rework and cost per accepted change, with a metric tree.
This post is also available in Deutsch.
“It feels faster” is not a measurement. AI productivity measurement has to separate how work feels from what the organisation gets: changes that were accepted, how long review took, how much was reworked and what it all cost. Perceived and measured speed can diverge, and AI tends to amplify what a team already does well or badly. This post proposes a small set of outcome metrics for agent-assisted work, shows how to build them from data you probably already have and lists the traps.
Why impressions mislead
The best-known controlled study of this question is from METR, which measured experienced open-source developers working on their own repositories:
Surprisingly, we find that when developers use AI tools, they take 19% longer than without—AI makes them slower.
Source: Measuring the Impact of Early-2025 AI on Experienced Open-Source Developer Productivity, METR, 2025-07-10.
Two caveats are essential. The page now carries a banner saying the results are out of date and that a 2026 continuation exists, so treat the number as a snapshot of early-2025 tools in one setting, not as a current verdict. And the study’s value is the method, not the figure: it compared actual task times with what developers expected and believed afterwards, and the two disagreed. The lesson that remains valid is that self-reports are a weak instrument.
Team-level data tells a related story. The 2025 DORA report summarises its main finding like this:
AI doesn’t fix a team; it amplifies what’s already there.
Source: Announcing the 2025 DORA Report, Google Cloud Blog, 2025-09-23.
If review is already a bottleneck, faster code generation moves the queue to review. If tests are weak, more generated code means more unchecked change. So measure the system, not only the author.
A metric tree
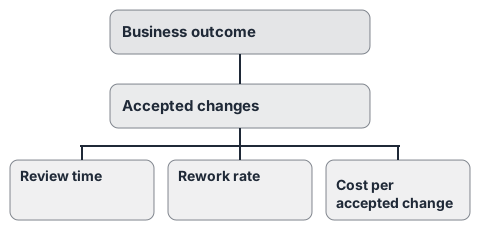
Start from the business outcome and work down to numbers an agent platform can produce.
- Business outcome: the reason you introduced agents, such as fewer days from request to delivery, shorter ticket resolution or less manual triage. Pick one, with a baseline from before the pilot.
- Accepted changes: the unit of value. A change is accepted when a person or a gate has approved it and it stayed in place. Draft output that was thrown away is cost without value.
- Review time: how long accepted changes wait for and spend in review. A rise means the agent is shifting work onto reviewers.
- Rework rate: the share of accepted changes that were reopened, reverted or fixed within a set window, say 14 days.
- Cost per accepted change: total spend (model usage, platform, reviewer time if you can estimate it) divided by accepted changes. This is the number that makes agents comparable with the alternative.
How to compute them
- Define “accepted” in your tools. Merged pull request without revert, ticket closed without reopening, report delivered without correction.
- Join three sources: agent run records (what ran, which agent, which use case), the system of record (merged, closed, reopened) and the cost data.
- Attribute cost per use case, not only per team. A per-agent, per-use-case breakdown shows which automations pay for themselves.
- Compare against a baseline, ideally the same work done without the agent in the same period, or the same team before the pilot. Without a baseline you have a trend, not an effect.
A useful formula:
cost per accepted change = (model cost + platform cost + review minutes x rate)
                           / accepted changes in the period
Include review minutes even if the estimate is rough; leaving them out flatters the agent.
What telemetry can and cannot tell you
Usage data answers “how much” and “where”. Anthropic’s documentation for Claude Code describes exporting it:
Track Claude Code usage, costs, and tool activity across your organization by exporting telemetry data through OpenTelemetry (OTel).
Source: Monitoring (Claude Code docs), live documentation (wording as fetched on 2026-10-04).
That gives you cost and activity by user, model and tool. It does not tell you whether the output was good. Join it with outcome data from your own systems, and be careful with individual-level reporting: ranking people by token use or lines generated rewards volume, which is exactly the wrong signal.
Traps to avoid
- Counting output. Lines, commits and generated documents are cost drivers, not value.
- Survey-only evidence. Ask people, but verify with measured times and outcomes.
- No quality guard. If speed rises while rework rises faster, you are shifting cost. Pair every speed metric with a quality metric; see quality gates for agent output.
- Measuring too early. Tools and habits change in the first weeks; run a pilot long enough to see steady state, as described in enterprise rollout: pilot first.
- Ignoring cost structure. Spend is variable and driven by usage; see FinOps for agents.
A cost export as a data source
In the current demo, a cost export for an invented tenant lists per-agent and per-use-case lines in a CSV preview. Such an export is the denominator of the main metric and the join key for the rest.
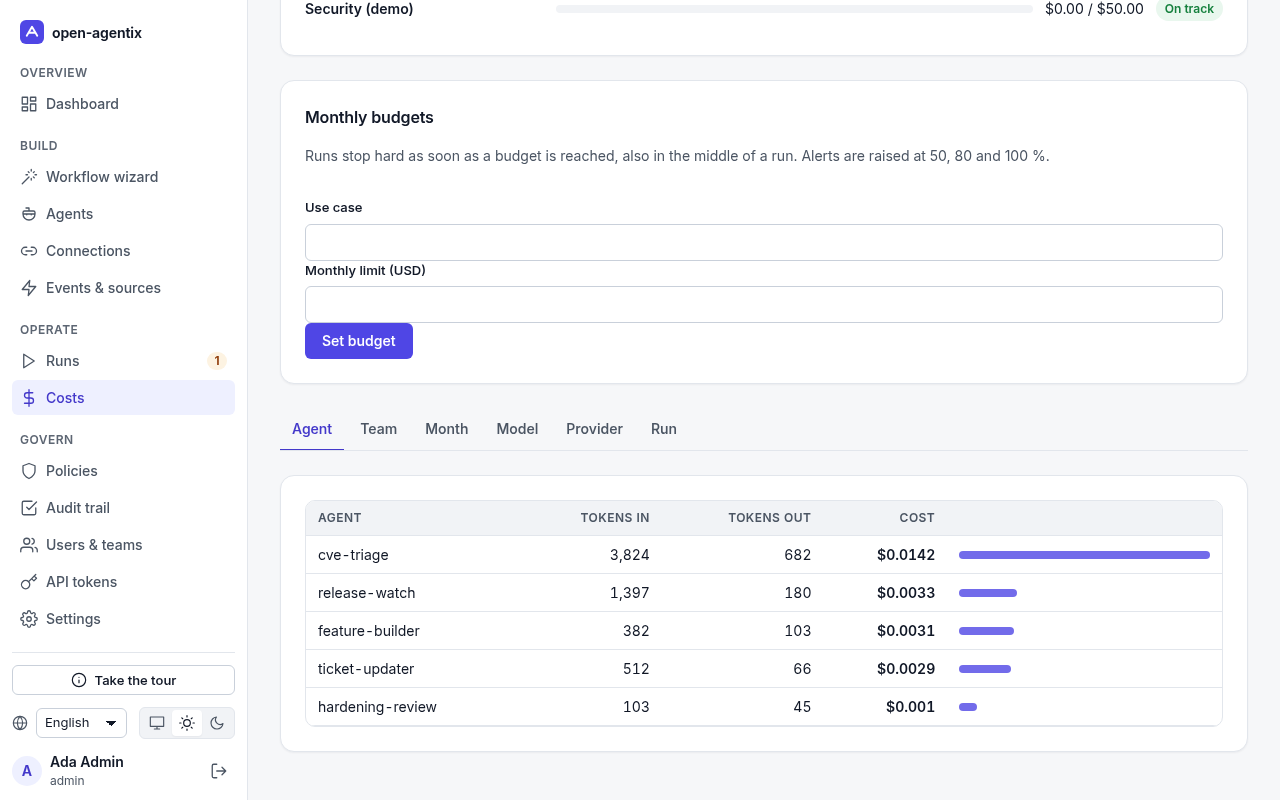
Screenshot of the current demo (fake data).
A first dashboard
Five numbers per use case, weekly: accepted changes, median review time, rework rate at 14 days, cost per accepted change and the share of runs stopped by a budget or a gate. Show trend lines against the pre-pilot baseline. If you can build only one chart, build cost per accepted change over time.
Key takeaways
- Perceived speed and measured speed can diverge; measure outcomes.
- The METR figure is a snapshot of early-2025 tools, and the page itself marks it as out of date; the method is the lesson.
- AI amplifies existing strengths and weaknesses, so measure the whole delivery system.
- Track accepted changes, review time, rework rate and cost per accepted change, against a baseline.
- Pair every speed metric with a quality metric and avoid ranking individuals by usage.
Sources
- METR, Measuring the Impact of Early-2025 AI on Experienced Open-Source Developer Productivity, 2025-07-10 (page marked as out of date).
- Google Cloud Blog, Announcing the 2025 DORA Report, 2025-09-23.
- Anthropic, Monitoring (Claude Code docs), live documentation.